Namshi.com was founded in 2004 by Muhammed Mekki and Faraz Khalid, and has since grown into the
Middle East’s leading fashion e-commerce business and is currently owned by Emaar Properties PJSC.
It was seen that analytics in the e-commerce industry was allowing firms around the globe to become
increasingly competitive and give companies a major competitive advantage. Including these analytics at
Namshi.com is discussed, identifying various applications of analytics and how they could
benefit the company in its implementation. The current issues experience in analytics is explored, with
the focus being on the four V’s of big data and data security and privacy being the most prominent
issues faced. Subsequently, utilising analytics for evidence-based decision-making was discussed for
Namshi.com including how big data analytics can impact the fashion industry. The Acito &
Khatri structural framework for business analytics is suggested as the framework to be introduced into
Namshi.com to introduce and build the analytical capabilities in the company. The various types
and sources of data that the organisation can use is explored giving use cases for each, while supply
chain analytics is discussed in detail for an e-commerce firm and how it can used to optimise the
overall supply chain. A discussion of web and social media analytics is given with the focus on how it
can be used to engage with customers is presented alongside a business challenge around the website and
product layout and how it would in turn affect sales. The solution to the challenge identified was to
implement customer journey and the Laws of UX with analytics to optimise the process, understand the
customer, and increase sales. Lastly, recommendations are given on how Namshi.com can improve
their analytical capabilities and remain competitive in the industry.
1. Introduction
In 2004, Muhammed Mekki and Faraz Khalid saw a gap in the Middle East online retailer market,
specifically for fashion. Together they took this opportunity to create Namshi.com, a fashion
e-commerce store similar to that of Zappos in the USA, ultimately looking at how they could tap
into the retail sector which contributes to 30% of Dubai’s GDP (Knowledge@Wharton, 2012). Over the
years, Namshi.com has continuously increased their sales over the past 5 years, and are
projected to continue their increase over the next few years, currently owned by Emaar Properties PJSC,
Namshi.com remains the number one online store in the UAE and continues to be an industry
leader in the Middle East (ecommerceDB, n.d.).
1.1. Analytics in E-Commerce
The e-commerce industry in the Middle East, specifically in the Gulf region has seen a major growth in
the industry over the last two years. These developing countries have seen a gradual shift in e-commerce
from the traditional brick-and-mortar models, with a 19.3% increase in market size since 2014. The
e-commerce industry has seen this increase due to advancements in technology such as smartphone
advancements, an increase in the use and speed of internet in the region, among various initiatives
supporting e-commerce including initiatives, establishing hubs to work with local and international
companies, and further adapting to the Fourth Industrial Revolution of adopting the digital
transformation (Mehta & Bhandari, 2018).
Analytics has become a fundamental, core competency of any e-commerce firm, adopting significantly large
amounts of data, both structured and unstructured, resulting in the industry being the one of the
fastest adopters of big data analytics (BDA). On a business level BDA is being used to allow the firm to
use the insights to lead strategies, make significant business decisions, and allow firms to gain a
competitive advantage in their industry. On a customer level, BDA is giving firms an opportunity to
identify new opportunities, personalise the customer experience, ultimately relating analytics in
e-commerce to a combination of business processes, emotional connection, and the optimisation of
technology (Akter & Fosso Wamba, 2016).
Furthermore, BDA provides unprecedented value to the respective firms by expanding the capabilities of
the firm. The capabilities of e-commerce through analytics, specifically big data analytics can include:
personalisation, which has been seen to increase customer loyalty and sales; dynamic pricing to allow
firms to remain competitive; customer service whereby analysing how to retain customers and monitor
customer value can be done; the end-to-end supply chain, where improvements and monitoring can be done;
security and fraud detection to keep customers safe; and predicative analytics aiding in taking the firm
into a sustainable future (Akter & Fosso Wamba, 2016).
1.2. Analytics at Namshi
With analytics and BDA becoming a core competency of many e-commerce firms, Namshi.com could
stand to drastically benefit from utilising it. It was seen that companies that prioritised data
analytics, focusing on being more data-driven saw an improved performance in financial and operational
matters, ultimately having those in the top 33% of their respective industry being more productive by 5%
and more profitable by 6% (McAfee & Brynjolfsson, 2012). Although Namshi.com is the number
one e-commerce firm in the fashion sector, it is merely regarded as a notable store compared to its
competitors, specifically the top four e-commerce firms in the Middle East, which are:
Amazon.ae, Noon, Souq, and Wadi. All of these e-commerce stores
launched after Namshi.com however are rated higher due to their similar design and feel to that
of Amazon (Lundt, 2020). In order for Namshi.com to be regarded as a fierce competitor to all
e-commerce firms in the Middle East, they should look for ways to apply BDA and analytics. Table 1
presents Namshi.com with various ways in which analytics can help the business improve.
Table 1: Table Detailing Various Applications of Analytics that can be Used
for Namshi.com
Analytics Application
Description
References
Personalisation
· Personalisation of a user’s experience including services, promotional
offers, etc. can result in a 10% increase in sales, and an ROI on marketing by up to
eight times.
· Recommender systems allow users to identify and improve customer experience,
boost sales by increasing conversion rates, increasing average purchase value of
customer, reducing churn.
(Akter & Fosso Wamba, 2016)
(Tomar, 2020)
(Srivastava, 2015)
Dynamic pricing
· With multiple competitors, understanding, adapting, and monitoring the price of
a product throughout the market can assist in determining a relevant price value,
increasing in sales.
· Understanding the customers, segmenting them, creation regression models, and
adapting the pricing will allow the firm to maintain a competitive advantage
(Akter & Fosso Wamba, 2016)
(Tomar, 2020)
Customer service
· Improving user experience through the store’s ability to recommend, more
payment methods, easier checkout, etc.
· Having a dedicated channel to monitoring customer feedback, further leading to
engaging with the customer over grievances, resolving the grievances, maintaining the
system proactively, ultimately creating an end-to-end great experience for the customer.
(Akter & Fosso Wamba, 2016)
Supply chain visibility
· Being able to manage third-party suppliers and partners that play an important
role in the business itself.
· Managing the overall supply chain assists in advising the business as well as
customers on expected delivery dates, stock levels, etc.
(Akter & Fosso Wamba, 2016)
Security and fraud detection
· Being able to identify various cases of fraud, unlikely customer purchases,
geospatial data, social media feeds, historical web activity can stop fraud cases from
happening.
· Improving security on e-commerce gives customers a sense of safety and
reassurance in their purchases, improving their experience, increasing loyalty, and
maintain customer trust
(Akter & Fosso Wamba, 2016) (Srivastava, 2015)
Predictive analytics and forecasting
· This allows business to predict personal customer’s potential value,
develop personalised marketing, develop and forecast potential budgets, improve supply
chain management.
(Akter & Fosso Wamba, 2016)
(Tomar, 2020)
(Srivastava, 2015)
Market basket analysis
· Potentially a fundamental of any e-commerce firm, being able to recommend
potential products to customers based on what they are currently buying to increase
sales and last-minute purchases.
(Tomar, 2020)
Merchant analysis
· Being able to work hand-in-hand with merchants to recommend new markets for
merchants to venture into, improving business relationships, and increasing sales.
(Srivastava, 2015)
2. Literature Review
2.1. Current Issues in Analytics
Although analytics add tremendous value to e-commerce firms, there are multiple challenges that the firms
need to deal with. One of the challenges is employee buy-in for big data, where it is seen that managers
are posed with multiple challenges in getting their frontline workers to understand and trust the big
data provided to them. This potentially stems down to either lack of knowledge of the capabilities of
model being used for the big data or lack of trust in the model itself. This was overcome by presenting
the data itself in a readable format which includes creating functional dashboards, reports, and
visualisations. This leads to greater challenges of training the managers and relevant employees in
adopting the big data (Akter & Fosso Wamba, 2016).
Subsequently, this leads to challenge of dealing with the sheer amount of data that is being collected
and analysed for the business. Large datasets are difficult to manage and can pose major issues when
presenting analytics in real-time (Li, 2020). These large datasets further pose a challenge for the
analysts as distinguishing relevant and irrelevant data becomes a timeous task as the dataset increases
in size (Bottles, et al., 2014). In conjunction to this, data quality is key to ensuring that there is
value added to the organisation through the analytics provided. The challenge of data quality lies in
the databases, applications, and storage used in the business, however if not maintained correctly or
even as a result of large data, should redundancies occur, it could drastically affect the
decision-making process. This aggregates to data governance and the challenges within it for big data
analytics (Akter & Fosso Wamba, 2016).
One of the biggest challenges is data privacy and data security and how exactly is this handled by the
organisation. This includes utilising data with consent of the customer through the organisation’s
“terms of use”. Through social media and registering for e-commerce sites, personal data is
constant being shared, and the introduction into biometric data is creates more concern and challenges
(Akter & Fosso Wamba, 2016). Coupled with this is the challenge of verifying the customer on the
site through online identity verification. While it can be implemented in a multitude of ways, ensuring
that the customer is who they say they are, is crucial in protecting the customer and they brand of the
business itself (Team Vue.ai, 2020).
Many e-commerce systems are built on top of multiple systems, generally termed a smart e-commerce system.
These systems have the challenge of interoperability, whereby the underlying systems are supervised by
various teams that utilise alternating infrastructure from cloud to physical systems. Furthermore, the
various supervisory teams have a specific skillset, background, and culture; creating a further
challenge for the organisation. Due to the various interoperability issues, e-commerce businesses may
find it challenging to analyse their systems and operations (Song, et al., 2019).
In addition, e-commerce challenges extend to customers involving customer experience, customer loyalty,
being able to take a potential customer to a paying customer, and even finding the correct customer.
Customer experience challenges the e-commerce design and presentation, dictating the ease of the
customer journey, whereas customer loyalty looks at how to retain customers, reduce churn and increase
their purchase power. The conversion of a customer to a paying customer is one of the biggest challenges
experienced in e-commerce firms as multiple factors come into play such as: website traffic, erratic
browsing, lack of interest, and even lack of personalisation. Lastly, identifying the target market and
further identifying the right customer is a challenge constantly being experienced, as it involves being
the prevalent choice over e-commerce competitors and brick-and-mortar stores, areas of shipping, and
shipping costs (Team Vue.ai, 2020).
2.2. Using Data for Evidence Based Business Decision Making
Companies that have defined themselves as data-driven saw improvements in their productivity and
profitability by 5% and 6% respectively. Furthermore, it was seen that these data-driven
businesses’ performance remained unhindered after accounting for the investment in IT, capital,
labour, and purchased services ultimately leading to increases in its respective stock market valuation
(McAfee & Brynjolfsson, 2012).
Although Namshi.com is an e-commerce firm for fashion, the company could utilise data and
analytics to feed innovation in the business. It can be seen that by incorporating the understanding of
data and analytics at every level to each role in the business saw drastic improvements in innovation
throughout the various areas in which analytics are used such as customer experience, marketing and
sales, corporate strategy, and developing new products and services (Marshall, et al., 2015).
Analytics and data can be used in supply chain management of the firm, by implementing various strategies
and models, Namshi.com could drastically improve their overall business. It was seen that firms
that implement and utilise big data at various points of their supply chain gained a competitive
advantage. Further, application of big data analytics into logistics saw companies identify and address
major issues within their business relating to delivery, and were able to identify ways of reducing the
cost of operating and methods of delivering their product in an eco-friendlier way. In conjunction to
this, research was done on the correlation between the rise in numbers of internet users and effects on
big data and supply chain management. It was seen that the human factor was the major dependency on the
improvement of big data and supply chain management (Samuel, et al., 2018).
Namshi.com can utilise data and analytics to impact their reach by implementing data-driven
marketing. With the use of data-driven marketing, results can be shown objectively, historic data can be
analysed and future trends could be modelled and predicted. This further extends to using customer
behaviour data to fully understand and implement effective marketing strategies. The impact of
data-driven marketing can improve business by identifying and reaching more customers similar to current
customers, prevent existing customers from churning, use the Pareto principle to identify the services
that produce the relevant investment returns, improve customer loyalty, personalise marketing and
seasonal campaigns, and improve current product offerings (Terneva, n.d.).
Data and analytics can also be used to aid customers in their purchase through recommendation systems and
to ensure customer safety through fraud detection. The focus on the customer is a choice used by many
e-commerce firms, where customer-specific data is constantly being utilised and mined such as
behavioural, transactional, and customer service to be able to offer a personalised experience and
ensure that the customer returns. eBay uses data analytics to identify areas of opportunity to gain a
competitive advantage by using the data and working hand-in-hand with their most loyal and largest
customers and sellers (Ferguson, 2013).
Acharya et al. interviewed professionals of all levels involved in the fashion industry and their
findings saw that if firms utilise their big data, it assists in creating and co-creating a strong
knowledge base which influences evidence-based decision-making. It was seen that the sharing of
knowledge occurred rather in the middle levels of the organisation and enabled managers to effectively
manage their inventory and sale price and added value to the business (Acharya, et al., 2018).
3. Implementation of the Analytics Program
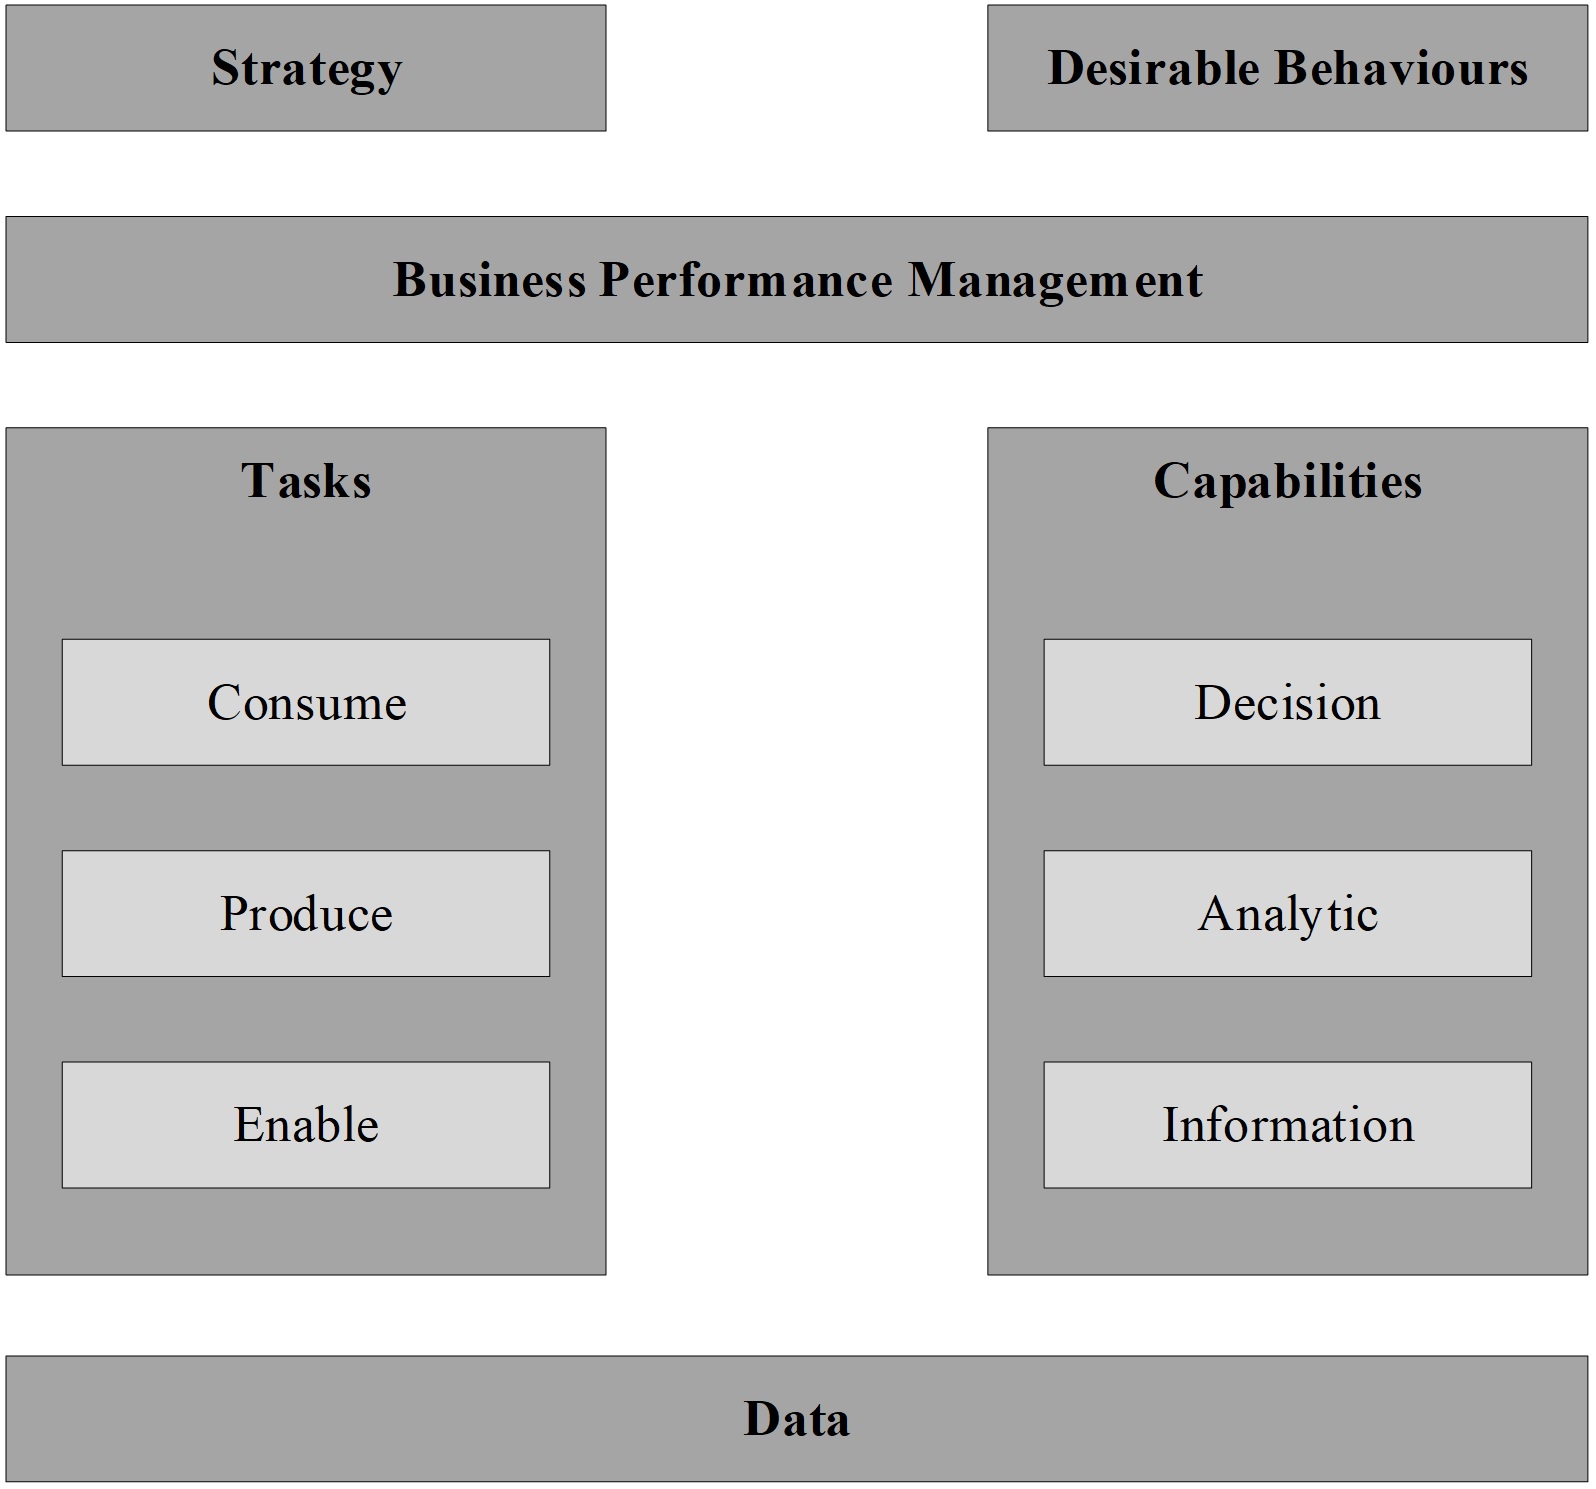
3.1. Using the Acito & Khatri Framework
Although Namshi.com is the leading fashion e-commerce organisation in the Middle East and ranked
451st globally, the organisation could stand to become a prominent figure in the overall
e-commerce industry in the Middle East (ecommerceDB, n.d.). In order to align the company’s
strategic goals and analytical capabilities, the Acito & Khatri structural framework for business
analytics should be the preferred choice. Figure 1 displays the framework designed by Acito &
Khatri.
Fig.1 - Acito & Khatri Structural Framework for Business Analytics (Acito &
Khatri, 2014)
With data being the foundation of the framework, as business analytics is defined as
leveraging the value or insights from the data itself. The use of this framework will allow
Namshi.com to utilise the data and acquire valuable insights and align these insights to the
business strategy, corporate culture and behaviours, performance management, and analytical tasks and
capabilities of the business itself (Acito & Khatri, 2014).
The strategy is the business’s plan of action on how they use their resources to
be successful, sustainable, and profitable for the next few years. It looks at answering questions such
as:
Who are the target customers?
What are the products we can offer our customers?
How do we work within the current market?
What or where is our competitive advantage?
How can we optimise our current way of working or processes?
Identifying and asking the questions can help the organisation define the strategy and in turn can define
the data that will be required for analytics (Acito & Khatri, 2014).
The desirable behaviours are defined internally in the company, by their culture,
beliefs, corporate value. Generally defined by the vision and mission statements, ways of work, and
corporate structure; these factors play a role in how the organisation and the employees value the
insights derived from the analytics, and how these insights contribute to the business
decision-making (Acito & Khatri, 2014).
Business performance management focuses on multiple aspects of the supply chain, but
looks to answer two questions:
How can the performance of the business be measured?
What determines business performance? (Acito & Khatri, 2014)
In data-drive organisations, analytical tasks are broken into three distinct categories
of: producing the insights, consuming the insights, and enabling the creation of the insights. Produce
is the process from sourcing the data to analysing to creating the insights, done by the analysts.
Consuming the insights is done by those who utilise the insights to make the business decisions.
Enabling is the general technical aspects that allow the analyst to produce their insights (Acito &
Khatri, 2014).
With technology being the enabler and supporter, the capabilities are dividing into
three types: decision, analytic, and information. The decision capability are the tools that support how
the insights are delivered, such as reports and dashboards. The analytic capability identifies with
methodologies, toolkits including models, statistics, descriptive, predictive, prescriptive analytics.
Lastly, the information capability is defined as the technology used to organise, share, integrate, and
describe data assets (Acito & Khatri, 2014).
3.2. Identifying the Sources of Business Data
Data in e-commerce transitions towards big data, and as a result conforms to the four V’s of big
data: volume, velocity, veracity, and variety. Volume speaks to the sheer amount of data that is
collected. Velocity is how often data is generated and delivered, or the speed of the data generated and
collected. Veracity refers to the quality of data that is going to be analysed. Variety refers to the
different types of data that will be generated and used (Akter & Fosso Wamba, 2016).
The sources of data for e-commerce can range and each can be utilised in specific use-cases, Table 2
presents a table summarising the main types of e-commerce data, various sources of the data, and use
cases of the data itself.
Table 2: Types, Sources, and Use Cases of E-Commerce Data
Type of Data
Description
Sources of Data Type
Use Cases
References
Transactional/Business Activity Data
Data as a result of the interactions between customer and business over time.
· Customer profile data
· Customer purchase data
· Inventory and sales data
· Customer reviews
· Recommender systems
· Personalisation of user experience
· Targeted marketing
(Akter & Fosso Wamba, 2016)
(Tkatchuk, 2020)
(Mandali, 2021)
Click-stream data
Data generated from the internet, through online advertisements, social media
· Social media
· Online advertisements
· Customer journey through e-commerce site
· Competitor pricing
· Best-selling merchandise and categories
· Recommender system
· Personalised marketing
· Optimising customer shopping experience
· Dynamic pricing
· Strategic and tactical advisory
Video and Image data
Unstructured data based off captured live images.
· Biometrics
· Customer purchase data
· Inventory and sales data
· Customer reviews
· Social media
· Suppliers and manufacturers
· Recommender system
· Personalisation of user experience
· Personalised marketing
· Data-driven decisioning
Voice data
Data collated from telephone calls, generally recorded and analysed from customer
service.
· Customer service calls
· Customer reviews
· Social media
· Call centres
· Transcriptions of conversations
· Improvement of customer service
· Optimising customer service and feedback process
· Personalised user experience
· Recommender system
3.3. Supply Chain Analytics
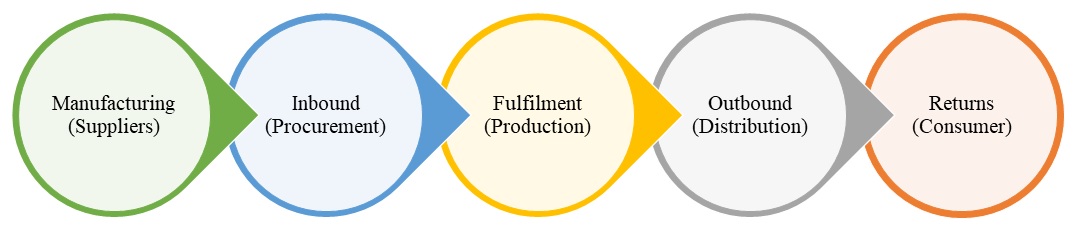
E-commerce firms have a general linear flow in terms of their respective supply chain, which can be seen
in Figure 2. This linear flow is the simplest way of analysing the supply chain and engaging in supply
chain analytics. While analytics is possible in all stages of the supply chain, from an e-commerce
perspective, the analytics that the business has control over is in the Inbound (Procurement),
Fulfilment (Production), and Returns (Consumer) stages (Murray, 2020).
Fig.2 - Typical Supply Chain of E-Commerce Firm
Inbound (Procurement)
There are a multitude of metrics leading to analytical capabilities present in the inbound
stage, while not as linear as the others, the focus of this stage converges to the availability of the
product to the customers. Table 3 presents various metrics, descriptions, and relevant measurements
taken to build the analytics in this stage (Murray, 2020)
Table 3: Inbound Metrics, Description, and Measurement
Metric
Description
Measurement
Purchase order frequency
How often is a purchase order done or cancelled?
· Volume of purchase order
· Price of order
Lead time
Time taken by the supplier from time of order to time of delivery to business.
· Mean lead time (average time per supplier)
· Variability of lead time (how often suppliers miss a lead time, and the severity
of it)
· Lead time segments (categorising and individually measuring suppliers)
Transit time
Time taken to deliver the product from the supplier to the business.
· Time per supplier
· Time taken from supplier to factory
· Time taken from shipping to transit
· Time taken from dock to factory floor
Cost of transport
The accumulated cost of transporting the inbound product.
· Cost of previous factors
Order accuracy
The number of products that were promised vs the number of products delivered
· Ratio between products ordered and delivered
Inventory
Inventory management is crucial in supply chain management as it dictates multiple business decisions
such as price, customer expectations, customer satisfaction, as well as supplier relationship
management. The analytics of inventory management is structured around data science, where analysts are
able to predict and forecast the supply and demand of certain product, considering the various data
aspects such as seasonality, marketing campaigns, promotional sales, etc. (Murray, 2020).
Fulfilment (Production)
The fulfilment stage is the final stage in the business before handing over to the delivery
partner company. The measurements and optimisation of this stage is linear and could see drastic
improvements from the use of analytics. Table 4 presents the metrics, descriptions, and measurements of
the fulfilment stage (Murray, 2020)
Table 4: Fulfilment Metrics, Description, and Measurement
Metric
Description
Measurement
Order to shipping
Time taken from when a customer places their order to when it is out for delivery
· Time taken from customer order to hand over to delivery partner
Path of order processing
The manner in which multiple products with different paths are processed.
· Time taken to receive different products from different suppliers
Outbound (Distribution)
Similar to the inbound stage, unless owned by the organisation themselves, the outbound
stage is less controllable and optimised if a delivery partner is being used. However, certain metrics
can be measured in order to find the optimal time, process, and method of delivery to the
customers (Murray, 2020).
Returns (Consumer)
The returns stage is also defined as reverse logistics whereby companies are able to utilise
specific data collected from customers and look at ways at improving the overall customer experience.
For example, the e-commerce firm could ask the reasons for returning a product to aid in identifying
potential issues, areas of concern, and create a risk mitigation plan (Murray, 2020).
3.4. Critical Analysis in Web and Social Media Analytics
Over the past decade, social media has evolved from a simple form of online interaction to a core
capability of most businesses today. Approximately 3.5 billion users are active on social media, with a
new account being created every 6.4 seconds. In conjunction to this, an average user has approximately
7.6 social media accounts spending nearly two and half hours on it per day (Alemdar, 2021). Utilising
social media analytics can reap multiple benefits for Namshi.com as it can drastically improve
customer engagement which in turn can improve the organisational strategy and business itself.
Utilising social media analytics can allow analysts to understand the customers. This extends to looking
at data such as time of posting and history of posts to improve marketing. By monitoring specific times,
Namshi.com will be able to publish specific marketing posts which would receive the maximum
number of viewers, driving more traffic to the website, resulting in potentially new sales. In
conjunction to this, understanding which social media platforms work for which products allows the
company to market specifically to customers in a personalised manner, in turn ensuring that the company
produces better content on the various platforms. Social media analytics can go further in
understanding, analysing, and finding opportunities by analysing competitor data, ensuring that
Namshi.com remains competitive and maintains their competitive advantage. From a marketing
perspective, social media analytics will allow the marketing team to better refine their strategy,
eliminating mistakes, optimising the performance and process, and leading to a larger customer base
(Quantzig, 2019).
Improving customer engagement through social media can also be done by dedicating a team to the various
platforms. By having a dedicated team, the customers are guaranteed swift and consistent assistance,
increasing customer loyalty and brand perception. Subsequently, responses from the customers can be
categorised using text analysis, to understand sentiment, consensus, and identify areas of improvement
(Wenzl, 2021).
Web analytics on the other hand can generate a wealth of information for most teams within the business.
Web analytics grants the organisation the ability to monitor how the website is being used, the traffic
present, the customers that are visiting the website, both old and new. Utilising various web analytic
techniques such as clustering, classification, association, path analysis, and sequential pattern gives
Namshi.com a multitude of benefits such as:
Recommending current and available products to customer interests
Improving customer experience
Performing target resource management
Testing the content relevancy and architecture of the website.
The benefits further extend to business applications such as targeted, personalised marketing campaigns,
effective management of customer base, improved customer service, and ability to predict customer
behaviour (Alghalith, 2015).
4. Business Challenge
When developing an e-commerce website, there are a multitude of factors that must be considered before
engaging with customers. Factors such as user experience, user design, competitor analysis, and customer
journeys must be considered as this will dictate the success of the website. In order to address the
challenge posed by the team, two aspects must be considered, namely user experience (UX) design and
customer behaviour and journey.
Addressing the UX design perspective can be done various ways, one of which is understanding the
psychology behind digital products and services in order to design better user interfaces. Jon Yablonski
defined these laws of UX across four distinct categories:
Heuristic
Principle
Gestalt
Cognitive bias.
Table 5 presents a description of the laws of UX defined by Jon Yablonski (Yablonski, 2020)
Table 5: Laws of UX
Category
Law of UX
Description
Heuristic
Jakob’s Law
· Customers will have expectations based on similar products and experiences.
· Users prefer to use the website as long as it works the same way as others that
they know of.
Fitt’s Law
· How easy is it for users to find the product they are looking for on the page
and how long does it take for them to click the link?
Hick’s Law
· As more options are presented, customer decision-making becomes more complex.
· Minimise cognitive load for new users.
Miller’s Law
· Content should be organised into smaller chunks, to allow users to understand
the product and memorise it.
Aesthetic-Usability Effect
· A website that is more aesthetically pleasing is deemed easier to use.
Principle
Postel’s Law
· Anticipate multiple ways in which users can interact with the website.
Tesler’s Law
· Certain core complexities can not be simplified or reduced.
· Ensure that interfaces are no over-simplified to a point of abstraction.
Doherty Threshold
· Ensure that the website is able to give some feedback within a 400ms timeframe
to increase and maintain user productivity.
· Animations are a solution to loading, making waiting tolerable.
Cognitive Bias
Peak-End Rule
· Focus on the intense points and end points of the user journey.
· Negative experiences are remembered more than positive experiences.
Von Restorff Effect
· Important activities or products must be distinctive visually.
· Among similar products, the one that is different will be remembered more.
The UX can also be analysed and measured quantitatively and qualitatively. Quantitative data includes
customer satisfaction, net promoter score, and customer effort score. This data can be collected through
the use of on-site surveys, pop-up widgets, heatmaps to understand where users are interacting with the
website. The analysis done on quantitative data will allow business to understand what the various
metrics and measures that determine the success of the business, as well as identifying areas of
optimisation and efficiency (hotjar, 2021).
Qualitative data would be collected through the use of on and off-site surveys, lab usability testing,
and session recordings. Utilising qualitative data allows the business to understand what are the
products that generate interest, how can certain products can be recommended, what are the blockers that
prevent a customer from completing a purchase, and what persuades customers to complete their purchase
(hotjar, 2021).
The customer behaviour and customer journey approach will look at identifying with customers, how they
think, act, and accomplish their goal. By utilising customer journeys, Namshi.com will be able
to truly personalise the customer experience from a technical and user perspective. Analysing the
customer journey map will give valuable insights into where expectations are not being met, whereby the
solution is to track back and identify what could have caused this to happen. Furthermore, it allows the
business to identify where the customer interacts with the business and seeks to find any unnecessary
interactions, such as having to continuously visit the website to see if the product or deal they would
like is available. Subsequently, identifying the weak points during the journey will be crucial to
ensuring the customer experience is continuously positive and aligns to the Peak-End Rule UX law. In
conjunction to the weak points, points of high interaction and high traffic can be identified to ensure
efficiency and great customer service (Salazar, 2020).
Namshi.com can address the challenges of team and website design through the use of UX analytics
coupled with the analytical capabilities in the proposed team. This will allow the organisation to
remain competitive, provide excellent customer service and in turn customer satisfaction, increase
sales, and gain the competitive advantage. The analytical capabilities should utilise data science and
advanced analytics methodologies to personalise content for customers through targeted and personalised
marketing, recommender system implementation, and great UX.
5. Recommendations and Conclusions
5.1. Recommendations
Although Namshi.com is the leading fashion e-commerce firm in the Middle East, the organisation
could implement the proposed analytics and analytical capabilities to ensure that sales are increased
and that the business remains competitive and a market leader. Although Namshi.com does have
the largest market share in the Middle East, it could be recommended that implementing analytical
capabilities such as predictive and prescriptive modelling, the organisation will be able to predict
potential outcomes for the foreseeable future.
This further suggests that Namshi.com could invest more in their analytical capabilities as it
will allow the company to become more competitive against bigger e-commerce firms. By investing into
these analytical capabilities such as web analytics, social media analytics, and UX analytics will allow
the company to truly personalise the experience for the customers, increasing customer loyalty and
improving customer sales.
While investing in the analytical capabilities will see Namshi.com become a more favourable
choice in the e-commerce industry, the company must take into consideration typical challenges faced by
customers such as data privacy and security. It could be recommended that the organisation improves
their analytical capability in the cybersecurity area to ensure customers trust their website and have
no concerns regarding data privacy.
Namshi.com has a strong internet presence and the introduction of a mobile application that can
be used in conjunction with the website will allow Namshi.com to embrace current trends, appeal
to their target market, improve customer service and experience, and in turn increase sales.
5.2. Conclusion
Namshi.com is the Middle East’s leading e-commerce fashion firm, controlling 5% –
10% of the market, and is one of the industry’s leading organisation in the Middle East. With the
introduction of analytics to the e-commerce industry, it’s effects and benefits are discussed in
detail. The use of analytics at Namshi.com are explored and discussed; highlighting the
company’s current position among other e-commerce firms and suggests various applications of
analytics and how they could benefit the organisation.
Current issues and challenges experienced in analytics in the industry are explored, discussing factors
such as the four V’s of big data, data security and privacy, gaps within the organisation’s
knowledge of analytics, and general issues experienced from an end-user perspective. It is further
discussed how Namshi.com could utilise analytics to make data-driven business decisions at
various points in the company.
A strategic plan is given on how to implement the analytics program suggesting the use of Acito &
Khatri’s structural framework for business analytics, and how it could be built within
Namshi.com. The various sources of data as well as types of data are explored, identifying
various use cases for each of the data types, as well as analysing supply chain analytics. Web and
social media analytics and the impact of it has been explored and the benefits of utilising it for
improved customer engagement has been discussed.
A business challenge relating to website layout and how products are displayed is identified and
addressed. It is suggested combining the Laws of UX and customer journey mapping that
Namshi.com will be able to provide a valid, reputable, and effective solution for their
customers. Lastly, recommendations are given on how Namshi.com could improve the analytical
capabilities, increase sales, and remain competitive in their industry.
Acharya, A., Singh, S. K., Pereira, V. & Singh, P. (2018). “Big data, knowledge co-creation
and decision making in fashion industry”. International Journal of Information Management,
Volume 42, pp. 90-101.
Acito, F. & Khatri, V. (2014). “Business analytics: Why now and what next?”.
Business
Horizons, Volume 57, pp. 565-570.
Akter, S. & Fosso Wamba, S. (2016). “Big data analytics in E-commerce: a systematic
review and agenda for future research”. Electronic Markets, Volume 26.
Alemdar, S. (2021). Social Media Interesting Facts You Need To Know In 2021. [Online].