
Pi Day Data Challenge
Onyx Data DNA Challenge: March 2022
14/01/2021
1. Problem Statement
In celebration of Pi Day (March 14), a fictional bakery has logged their sales from the past 2.5 years and would like their data analysed in order to make better decisions based on the trends of the provided data.
2. Data
The data is from Onyx Data's DNA Challenge website, which can be accessed here.
3. Data Dictionary
The following data dictionary is a combination of that provided by Onyx Data as well as any columns added to the loaded data prior to any pre-processing was done. Those highlighted in red are created in Excel, expanding on existing data columns.
| Column Name | Description | Data Type |
|---|---|---|
| Order NO | Order number of Pie Bakery orders | String |
| Order Date | Date order was placed | Date |
| Month/Yr | Month & Year abbreviation of the Date of order | Date |
| Order Day | Day of the month the order was placed | Integer |
| Order Month (Text) | The Month the order was placed | String |
| Order Year | The Year the order was placed | Integer |
| Day of Week | Day of the week the order was placed | String |
| Pie Flavor | The flavor of the pie(s) ordered | String |
| Quantity | Quantity of pies ordered | Integer |
| Cost | Total cost of pies ordered | Float |
| Slice Or Whole Pie | Slice or Whole Pie ordered | String |
| Pre-Order/In-Store Purchase | Denotes if the order was made in store or pre-ordered | String |
| Organic? | Organic if the pie filling ingredients were certified organic | String |
4. Pre-Processing
Although the data provided is generally clean and organised, some pre-processing is still done. Firstly, the Day of the Week is actually incorrect, and as a result is redone in DAX to ensure the correct day is used. The following DAX command is used:
Day of the Week = FORMAT(Data[Order Date], "dddd")
Further, to ensure that the days are displayed in the correct order and not alphabetically, we associate each day to a number corresponding, for example by default Sunday is 0, Monday is 1, up until Saturday which is 6. Personally, I prefer Monday to be 1, and Sunday to be 7. In order to create that association, the numbers generated per day is executed as follows:
DayNum = WEEKDAY(Data[Order Date],2)
From there, the Day of the Week is sorted by DayNum. The dashboard can now be created from there.
5. Dashboard
The dashboard was built in Power BI and can be downloaded here.
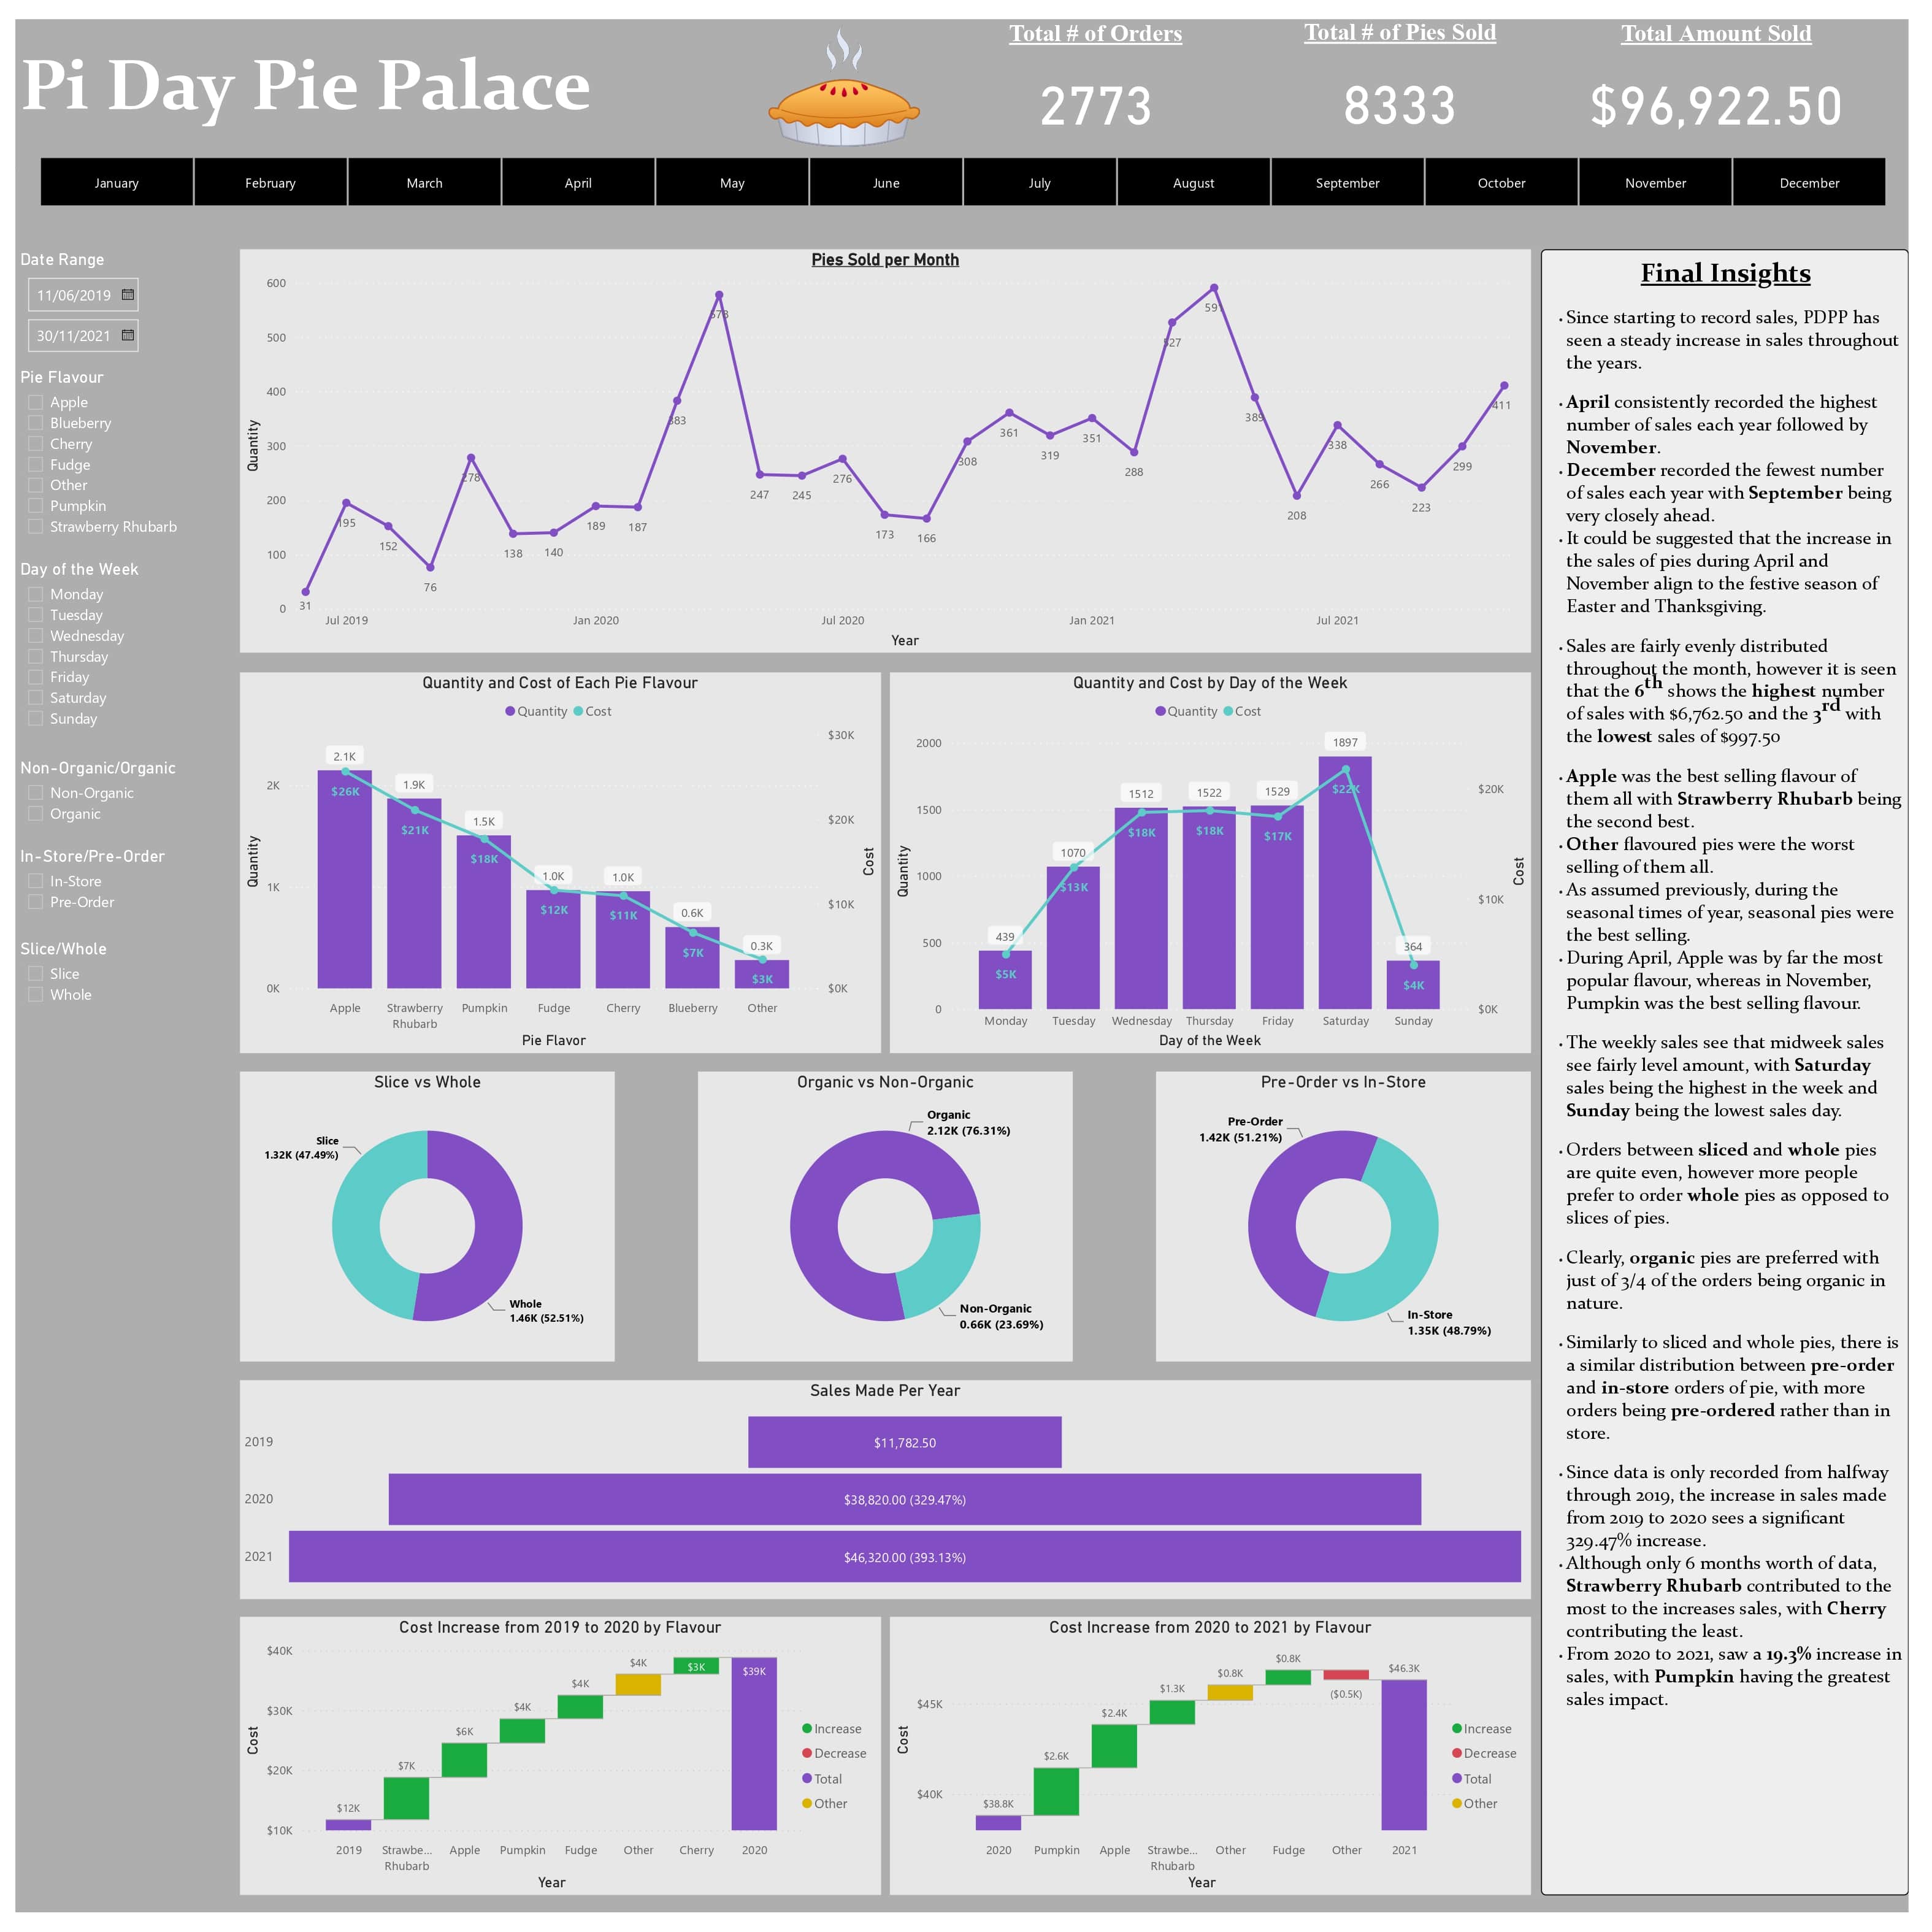
A screenshot of the dashboard is seen below:
6. Final Analysis
- April consistently recorded the highest number of sales each year followed by November.
- December recorded the fewest number of sales each year with September being very closely ahead.
- It could be suggested that the increase in the sales of pies during April and November align to the festive season of Easter and Thanksgiving.
- Sales are fairly evenly distributed throughout the month, however it is seen that the 6th shows the highest number of sales with $6,762.50 and the 3rd with the lowest sales of $997.50
- Apple was the best selling flavour of them all with Strawberry Rhubarb being the second best.
- Other flavoured pies were the worst selling of them all.
- As assumed previously, during the seasonal times of year, seasonal pies were the best selling.
- During April, Apple was by far the most popular flavour, whereas in November, Pumpkin was the best selling flavour.
- The weekly sales see that midweek sales see fairly level amount, with Saturday sales being the highest in the week and Sunday being the lowest sales day.
- Orders between sliced and whole pies are quite even, however more people prefer to order whole pies as opposed to slices of pies.
- Clearly, organic pies are preferred with just of 3/4 of the orders being organic in nature.
- Similarly to sliced and whole pies, there is a similar distribution between pre-order and in-store orders of pie, with more orders being pre-ordered rather than in store.
- Since data is only recorded from halfway through 2019, the increase in sales made from 2019 to 2020 sees a significant 329.47% increase.
- Although only 6 months worth of data, Strawberry Rhubarb contributed to the most to the increases sales, with Cherry contributing the least.
- From 2020 to 2021, saw a 19.3% increase in sales, with Pumpkin having the greatest sales impact.
It can be suggested that going forward Pi Day Pie Palace could use this data to make crucial business decisions. For instance, ensuring a larger supply of ingredients during April and November could allow the business to make more pies, and if the ingredients are organic in nature can increase the number of organic pies sold. Furthermore, marketing can increase sales through specific festive marketing campaigns.
Since Apple and Strawberry Rhubarb are the best selling flavours it can be suggested to ensure a consistent supply of these flavoured ingredients to keep the best sellers in stock and best in selling.
Pi Day Pie Palace is on track to sell more in 2022, and based on the trends from the previous two years, it can be suggested that Strawberry Rhubarb, Pumpkin, and Apple pies will be the biggest contributors to PDPP increasing their sales, especially if they are able to market it correctly.
Since there is a clear preference for Organic pies, finding a supplier to supply on organic ingredients will allow PDPP to migrate towards selling only organic pies.